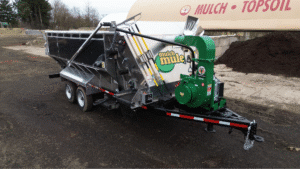
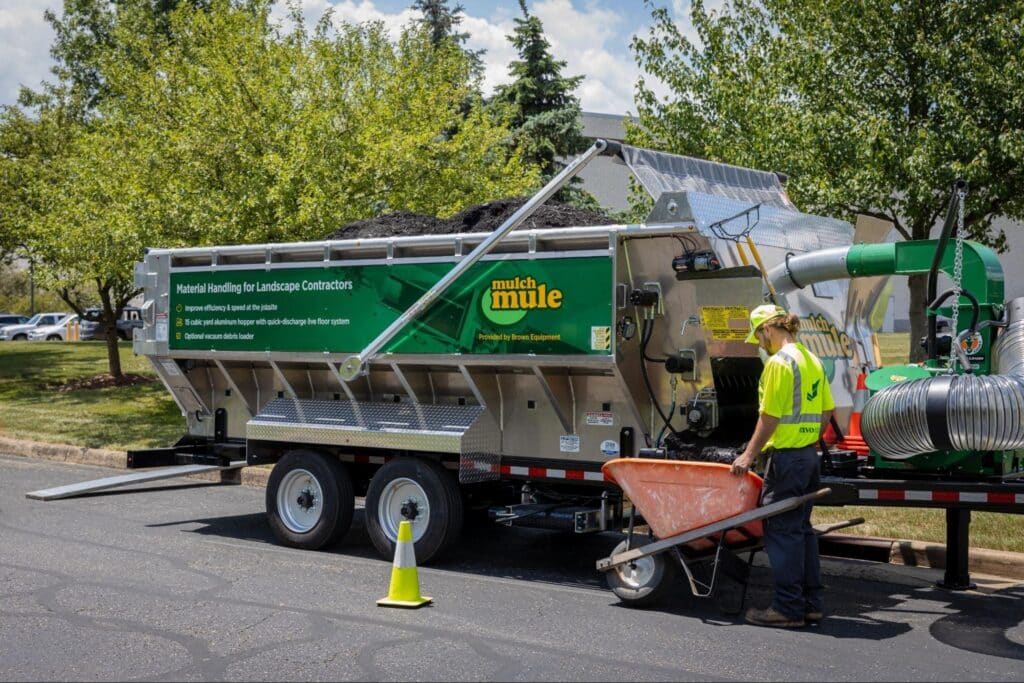
Landscaping is evolving fast as automation tools—such as live floor trailers and vacuum debris loaders—reshape daily operations and material handling. But buying new equipment is only part of the equation. To fully harness these benefits, it’s vital to track clear, consistent landscaping KPIs that validate the investment and show exactly where performance is improving (or slipping). This practical framework helps you optimize workflows, reduce waste, improve uptime, and fuel sustainable business growth.
Why Landscaping KPIs Are Critical After Automation
Investing in automation is only the first step. To ensure your new technology continuously improves operations, you must measure its impact with clear, well-defined KPIs. Tracking these indicators reveals efficiency gains—like fewer labor hours and faster task completions—and alerts you to issues such as downtime or excess material waste. Regular performance reviews based on these metrics empower you to make data-driven decisions that promote sustainable growth. In today’s competitive market, understanding and leveraging automation-driven improvements is essential for long-term success.
Establishing Your Baseline: The Foundation for Measured Improvement
Before, or shortly after, implementing any automation system, gather performance data over a two- to four-week period. Key metrics to record include:
- Job start and completion times
- Crew sizes and roles
- Quantities of material moved or installed
- Fuel consumption and the number of trips
- Material waste percentage
- Time spent on rework and cleanup
By standardizing your data collection across similar projects, you create a reliable baseline for future comparisons. This initial evaluation not only reveals current performance but also guides later improvements once the automation is in full operation.
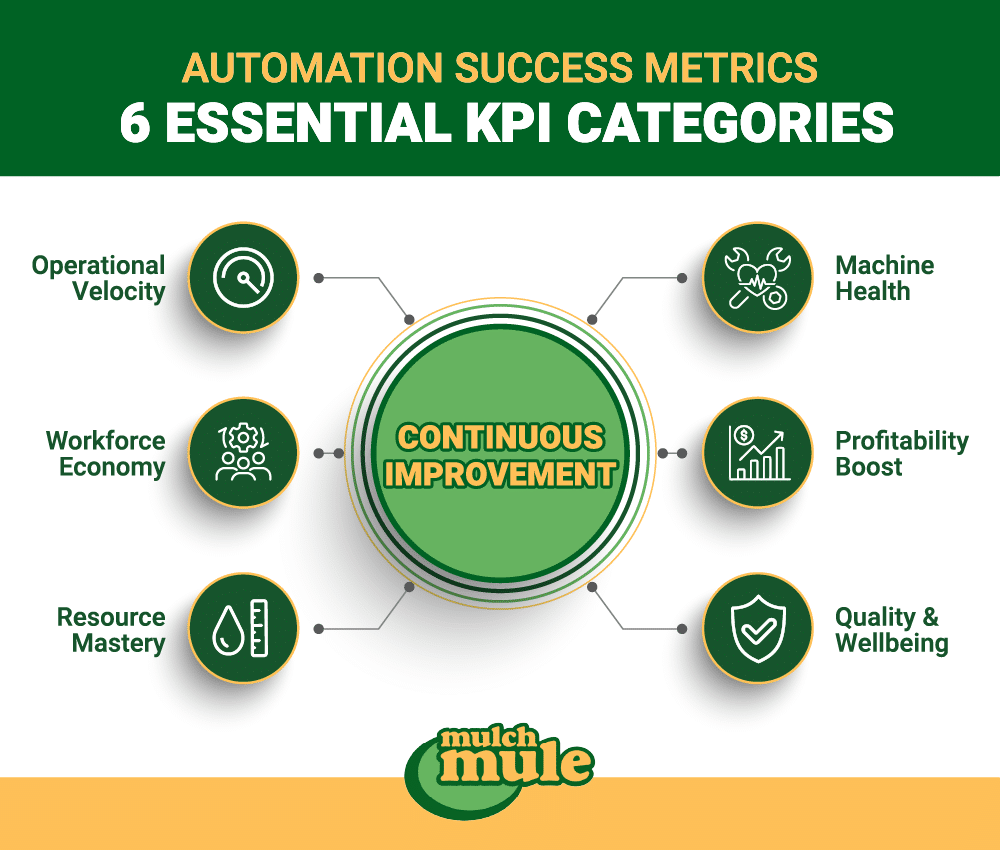
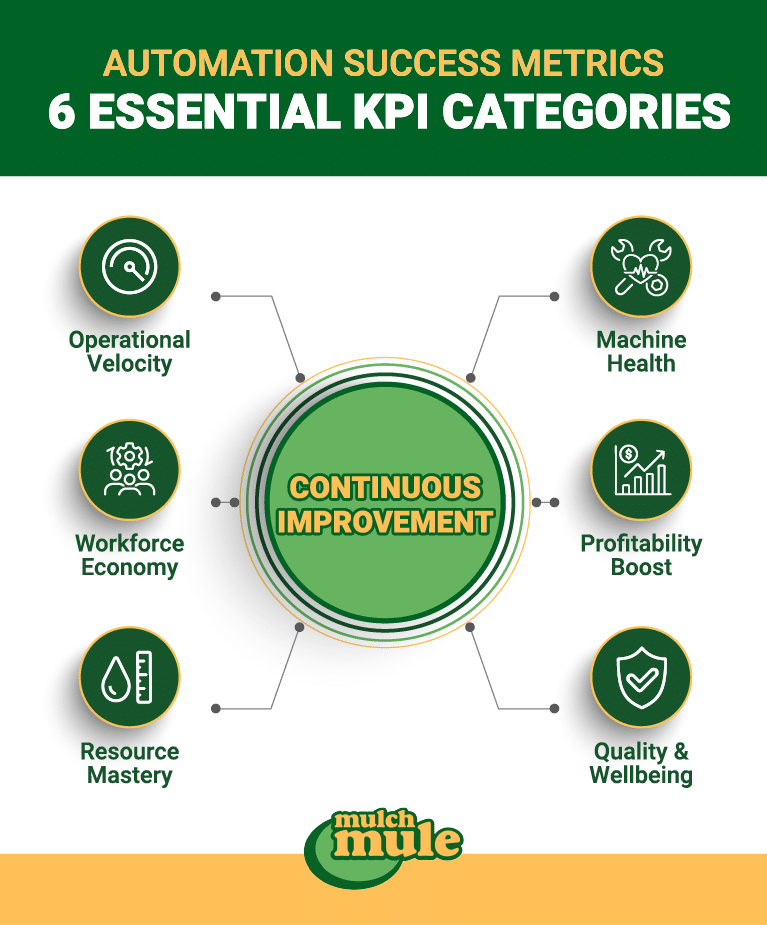
KPI Scorecard: Key Metrics for Automation Success
A well-organized KPI scorecard groups critical metrics into clear categories. Each metric is defined by a straightforward formula, making it easy for your team to understand and track progress.
Productivity KPIs
- Labor Hours per Cubic Yard Installed: Divide total labor hours by the cubic yards installed.
- Yards Installed per Hour: Measures work pace and overall efficiency.
- Jobs Completed per Day/Week: Higher numbers indicate increased capacity.
- Material Placement Cycle Time: Shorter cycles reflect smoother, more efficient processes.
Labor KPIs
- Labor Cost per Job/Yard: Lower costs suggest improved efficiency.
- Overtime Percentage: Fewer overtime hours indicate better scheduling.
- Crew utilization rate: The ratio of billable hours to total work hours.
- Adjustments in Crew Size: Tracking changes in crew size post-automation offers insights into resource deployment.
Material KPIs
- Material Waste Percentage: Compare the delivered material with what is used; lower waste means more precise application.
- Rework and Cleanup Time: Shorter times suggest fewer errors and better planning.
- Material Usage Accuracy: Measure the variance between estimated and actual material usage to refine future estimates.
Equipment KPIs
- Equipment Uptime Percentage: The ratio of operating time to available time, indicating maintenance effectiveness.
- Operating Cost per Hour: Lower costs reflect efficient equipment management.
- Materials Throughput Rate: Evaluates how much material equipment processes each day.
Financial KPIs
- Gross Profit per Project: Increases here validate the financial advantages of automation.
- Investment Payback Period: Tracks how quickly the savings recover the initial cost.
- Revenue Capacity Gains: Measures additional earnings driven by operational efficiency.
Safety and Customer KPIs
- Workplace Incidents: Fewer incidents indicate a safer work environment.
- On-Time Completion Rates: High rates are essential for customer satisfaction.
- Callback Frequency: Lower callbacks are a sign of quality work and process discipline.
Each KPI should be clearly defined with its calculation method, data source, tracking frequency, and accountable owner. This clear structure helps every team member interpret the numbers in the same way and target specific operational improvements.
KPI Quick Reference: Make the Metrics Unambiguous
| KPI Name | Exact Formula | Data Source | Recommended cadence | Owner (who’s responsible) |
| Labor Hours per Cubic Yard Installed | Total direct labor hours ÷ total yd³ installed | Time tracking + job ticket/material log | Weekly | Ops Manager |
| Yards Installed per Hour | Total yd³ installed ÷ total direct labor hours | Time tracking + job ticket/material log | Weekly | Ops Manager |
| Jobs Completed per Day/Week | # completed jobs ÷ # days (or weeks) in period | Dispatch/job management | Weekly | Dispatch Lead |
| Material Placement Cycle Time | Job completion time − job start time (use timestamps) | Dispatch/job management | Weekly | Ops Manager |
| Labor Cost per Job/Yard | Direct labor cost ÷ # completed jobs (or ÷ total yd³ installed) | Payroll + time tracking | Weekly (monthly true-up) | Finance |
| Overtime Percentage | Overtime hours ÷ total labor hours × 100 | Payroll/time tracking | Weekly | Ops Manager |
| Crew Utilization Rate | Billable hours ÷ total paid hours × 100 | Time tracking | Weekly | Ops Manager |
| Material Waste Percentage | (Delivered volume − installed/used volume) ÷ delivered volume × 100 | Supplier tickets + as-built/field measurement | Weekly | Foreman |
| Rework and Cleanup Time | Rework + cleanup labor hours ÷ total direct labor hours × 100 | Time tracking + job notes | Weekly | Ops Manager |
| Equipment Uptime Percentage | Operating hours ÷ available scheduled hours × 100 | Equipment log/telematics + maintenance log | Weekly | Fleet Manager |
| Operating Cost per Hour | (Fuel + maintenance + repairs) ÷ operating hours | Accounting + fuel cards + equipment log | Monthly | Fleet + Finance |
| Gross Profit per Project | Job revenue − job COGS | Job costing/accounting | Monthly | Finance |
| Investment Payback Period | Automation cost ÷ monthly savings | Finance model + baseline KPI trend | Quarterly | Owner/GM |
| On-Time Completion Rates | # jobs completed by promised time ÷ # completed jobs × 100 | Dispatch/job management | Weekly | Dispatch Lead |
| Callback Frequency | # callbacks within 14 days ÷ # completed jobs × 100 | Customer service log + job system | Weekly | Customer Success/Ops |
Normalizing KPIs By Job Type
To keep comparisons fair, report key KPIs (labor hours/yd³, cycle time, waste %, GP/job) in segments, not just as one blended number.
Mulch Vs Soil Vs Rock Vs Debris
- Mulch/soil: normalize by yd³ installed (e.g., labor hours ÷ yd³).
- Rock/debris: normalize by tons moved/removed (e.g., labor hours ÷ tons, dump fees ÷ tons).
Residential vs Commercial Vs HOA
- Report KPIs separately by customer type (different scheduling rules, approval steps, and job complexity).
- At minimum: cycle time, on-time %, gross profit/job by segment.
Access Constraints
- Tag each job as Tight or Open access.
- Compare productivity metrics (like labor hours/yd³ and cycle time) within the same access type so “hard access” jobs don’t distort the trend.
Where the Data Comes from (Low-Tech to High-Tech)
Automation creates better numbers only if you can capture them consistently. The good news: you don’t need a perfect tech stack to start tracking KPIs—you just need reliable inputs. Here are the most common data sources, from simple spreadsheets to more advanced tracking tools.
- Spreadsheet method (good enough to start): Start with one shared sheet and log the basics per job: start/finish time, crew hours, yards/tons, loads, and rework/cleanup time. Consistent fields and consistent entry matter more than fancy tools.
- Time-tracking + job costing software: Have crews clock in/out by job and connect labor, materials, and fees to each ticket. This makes weekly KPI scorecards and job profitability reporting much easier (and more accurate).
- Equipment logs and maintenance tracking: Track operating hours, downtime, and service dates for each machine. Even simple notes on why downtime happened help reduce repeat failures and protect uptime.
- Optional: GPS/telematics and sensor-style data (if available): Use GPS/telematics to capture drive time, idle time, engine hours, routes, and fuel burn automatically. It’s not required to start, but it sharpens utilization, cycle time, and cost-per-hour KPIs.
What “Good” Looks Like

KPIs aren’t about chasing perfect industry numbers—they’re about proving your automation is improving throughput, reducing waste, and protecting margin over time. Focus on clear targets, clean trends, and fast interpretation so you can fix issues early and keep the gains.
Directional Benchmarks
Use your baseline as the “benchmark,” then aim for steady improvement in the KPIs automation should affect first:
- Productivity: labor hours per yard down, yards per hour up, more jobs completed per week.
- Speed: cycle time down and more predictable (less variance between jobs).
- Waste + rework: waste % down, rework/cleanup time down.
- Utilization: crew utilization up without overtime spikes. If you’re moving the right direction for 4–6 weeks in a row, that’s usually a stronger signal than hitting a single “ideal” number once.
Red Flags that Mean the Process is Broken, Not the Equipment
When automation “isn’t working,” the root cause is often workflow, training, scheduling, or estimating—not the machine itself.
- Uptime down: If breakdowns or downtime increase, look for operator training gaps, missed preventative maintenance, lack of spare parts, or the wrong tool being assigned to the wrong job type.
- Waste up: Rising waste usually points to estimating errors, poor staging/setup, inconsistent install depth, or rushing to meet schedule—not an automation failure.
- Cycle time flat despite automation: If cycle time doesn’t improve, the bottleneck is likely upstream or downstream—slow loading, long travel paths on site, access constraints, dispatch gaps, or too much time spent waiting on instructions/material placement decisions.
The 30 / 60 / 90-day KPI Rollout Plan
A phased approach can help streamline this effort:
- In the first 30 days, gather baseline data and confirm that equipment is performing as expected.
- At 60 days, expand tracking to include safety and waste management metrics.
- After 90 days, conduct a comprehensive review that also incorporates customer feedback.
This systematic process turns raw numbers into actionable insights, guiding you to reallocate resources or adjust processes for better performance.
Making KPI Insights Actionable
KPIs only add value when they are translated into concrete actions. Address the most common issues with targeted strategies:
Reducing Labor Hours per Installation
- Optimize jobsite layouts to minimize travel time between material storage and work areas.
- Reorganize workflows and enhance training so teams fully leverage automated systems.
Minimizing Material Waste
- Tweak equipment settings for more precise material delivery.
- Regularly compare projected usage against actual usage and hold planning sessions to align estimates with reality.
Improving Equipment Uptime
- Implement a strict preventive maintenance schedule.
- Provide enhanced operator training and maintain critical spare parts to quickly address any malfunctions.
By focusing on these specific areas, you can swiftly resolve challenges and build momentum for continued operational improvements.
Kpi Tracking Checklist (To Make Automation Gains Stick)
Automation improvements don’t hold automatically—your tracking routine is what keeps them from slipping. Use this quick checklist to keep KPI data consistent, spot problems early, and turn performance trends into repeatable operational wins.
- Set a weekly KPI rhythm. Review the same scorecard every week and assign one owner + one next step for anything off track.
- Lock your definitions and units. Define “completed job,” choose yd³ vs tons (and conversion rules), and use the same timestamps every time.
- Standardize data capture at job closeout. Require the same fields on every job (hours, volume, loads, downtime, rework/cleanup) so trends are comparable.
- Segment before you compare. Break results out by material type, customer type, and access (tight vs open) to avoid distorted averages.
- Treat key shifts as process signals. Uptime down, waste up, or cycle time flat usually points to training, staging, scheduling, estimating, or maintenance—not “bad equipment.”
- Adjust for seasonality. Compare performance to the same-season baseline (or YoY) and set peak vs off-peak targets so normal seasonal swings don’t mislead decisions.
- Optional: add dashboards after the inputs are consistent. Dashboards help visibility, but only once the underlying data is clean and repeatable.
FAQ: Landscaping Automation KPIs
What KPIs should landscaping companies track after automation?
Start with KPIs that show speed, labor efficiency, waste, uptime, and profit. A simple core set is: labor hours per yd³ (or per ton), cycle time, jobs completed per week, material waste %, equipment uptime %, and gross profit per job.
How do you calculate labor hours per cubic yard?
Labor hours per yd³ = Total direct labor hours ÷ Total cubic yards installed.
Use direct hours tied to the job (not admin/shop time) and keep units consistent across jobs.
What is a good equipment uptime percentage?
A common target is 90%+ uptime during scheduled operating hours. If uptime is consistently below that, it usually points to preventive maintenance gaps, training issues, or repeated failure points that should be addressed.
How do you track material waste for mulch or soil installs?
Material waste % = (Delivered volume − installed/used volume) ÷ delivered volume × 100.
Delivered volume comes from supplier tickets; installed/used volume comes from field measurements or verified takeoffs.
Why didn’t our cycle time improve after automation?
If cycle time stays flat, the bottleneck is often outside the equipment: loading delays, long on-site travel paths, access constraints (tight sites), dispatch gaps, or waiting on instructions/decisions. Track timestamps to locate where the time is actually going.
How long does it take to see ROI from a live floor trailer?
It depends on job mix and volume, but many crews can see measurable savings within 30–90 days once they establish a baseline, use consistent KPIs, and stabilize the workflow. A simple payback formula is: Payback period = automation cost ÷ monthly savings.
Should KPIs be tracked differently for mulch vs rock vs debris?
Yes. Normalize by the right unit: yd³ installed for mulch/soil, and typically tons moved/removed for rock/debris (plus dump fees per ton for debris). This keeps productivity and cost comparisons fair.
How often should we review KPI performance?
At minimum, review operational KPIs weekly (labor efficiency, cycle time, waste, uptime). Review financial KPIs like gross profit per job at least monthly (or weekly if your job costing is reliable).
Turn Automation into Measurable Growth
Automation in landscaping goes beyond investing in new equipment—it requires a comprehensive strategy for tracking performance. By establishing a solid baseline, creating a focused KPI scorecard, and consistently reviewing data, you can ensure your automation investments drive sustainable, measurable growth.
Want help choosing the right automation setup—and the KPIs to track so you can prove ROI quickly? Contact Mulch Mule today for a personalized demo. We’ll talk through your job mix, access constraints, and material handling workflow, then recommend equipment options that fit your operation.